Data Types and Its Presentation
神掌打通任督二脈‧易筋經以簡馭繁
符號意義: 統雄快訣
統雄快訣
 延伸閱讀
延伸閱讀
 進階議題
進階議題
 警示訊息
警示訊息
虛擬變項與資料虛擬值 Dummy Variable and Dummy Value
等序資料與無母數統計(Non-parametric statistics)
公共統計圖的繪製
學術統計圖
直方圖 Histogram
散佈圖 Scatter plot
|
資料型態與理論類型共同決定統計工具的選擇,資料型態可簡化分為2大類:類別資料、連續資料,以下再分各小類。 資料的視覺呈現包括:公共統計圖(政府統計、商務統計)與學術統計圖,及多種子圖。 |
變項 Variable
研究的資料收集,是根據理論建構的變項而收集。
變項 Variable 是指「某種特徵的集合,而該特徵具有質或量上的差異,亦即可變的」。
變項的資料型態有以下幾項分類。
變項資料型態
數量研究的目的係收集可以比較的變項資料以供統計分析,由於變項資料型態(data types)不同,使得計量精致程度亦有別。統計學家一般把資料分成四種型態:類別資料(nominal data)、等序資料(ordinal data)、等距資料(interval data)、及等比資料(ratio data)。應用上可簡化分為2大類:類別資料、連續資料。
data types 或稱 data levels, data 就是指 variable (變項)的值,所以類別資料也可稱類別變項,以此類推。
類別資料
類別資料是收集所得的資料是一個「類別」而不是一個可以比較大小的「數值」,譬如調查「性別」的資料是「男」或「女」,調查「電視收視率」的資料則是「臺視」或是「中視」、「華視」。
類別資料的水準
類別資料所包括的「類別」,統計上稱為「水準(level)」。譬如「性別」資料包括男、女2個類別,就是有2個水準。如果把「職業」分作士農工商,就是有4個水準。如果有一個量表可以把人的「動機」分作高中低3類,就是有3個水準。
「水準」這個中譯其實有點怪怪的,但如果使用「類別資料的類別」,好像也很容易混淆,所以就當成「專門定義專有詞」,倒也差強人意。
二元資料
有些類別資料,自然只能分為兩類:是或否,有或無。譬如性別只能分為男或女,具有數學上「二項分配」(binomial
distribution)的性質,或稱為「二元資料」(dichotomous data)。
至於分類在三種以上的則稱為「多項分配 (multinomial distribution)」,或「多元資料」(polychromous
data),譬如「電視收視率」的資料等。
有些資料事實上並不只2類,但在統計上把它合併為2類,譬如在選舉調查上分為只有「藍、綠」兩種政黨,也可以相當於「二元資料」,也可以適用二項分配的性質。這種處理方法,有些學者稱為「人為二元資料」(forced dichotomous data)。
binomial 中譯「二項」;dichotomous 中譯「二元」,但從適域性來看,「二元」較易理解,且學生對「二元」的語意反應較為敏銳,故本研究者引用此概念時均稱為「二元」。
虛擬變項與資料虛擬值
Dummy Variable and Dummy Value
Dummy Variable 虛擬變項,是指將類別變項的「二元變項」、或「人為二元變項」的2個水準,轉化為「0,1」,從而可以虛擬為連續變項,也可以使用適用於連續資料的統計工具。
「二元變項」如「性別」:0 為女,1為男。
「人為二元變項」:在多元類別資料時,如果將各水準設定:沒有﹦0,有﹦1,就是將各水準建構為「人為二元變項」。
如收視率研究中:建構「臺視」變項,0 為不看臺視,1為看臺視。
有或沒有,不一定要設為「0,1」,但通常設為差距為1。
如使用網路:沒有﹦1,有﹦2。
Dummy Value 虛擬值可以指以上Dummy Variable 虛擬變項中,特定的「0,1」值;也可以指任何類別變項中,對各水準設定1個數值。
連續資料
連續資料是指可以比較大小、先後…具連續性的資料,古典觀念又分為3級。
等序資料
等序資料是收集所得的資料,可以比較大小,但是其間的差距不明確。譬如調查樣本對某公共政策的意見是「十分贊成?很贊成?贊成?反對?很反對?十分反對?」我們收回資料後,知道「十分贊成」的態度強於「很贊成」,「很贊成」又強於「贊成」,但是「十分贊成」、「很贊成」與「很贊成」、「贊成」之間的差距是不是一致呢?我們並無法明確測量出來。
等距資料
等距資料就是資料數值之間的距離,可以明確測量出來。譬如溫度資料、長度資料,彼此之間的高下長短,就有很具體的差距。
等比資料
等比資料就是等距資料中又具有「真正絕對零度」的特殊情形的。如溫度就沒有真正絕對零度,不能稱為等比資料;而長度有絕對零度,故為等比資料。
連續資料與準連續性資料
不過,社會科學家在實際應用資料時,都假設等序資料的階級之間,具有一種抽象 相等的距離;而等距資料和等比資料的區別又不十分必要,故常把等序、等距、等比三種資料合稱為「連續資料」(continuous data),和「類別資料」彼此對稱,作為選擇統計方法的重要依據。
類別資料中的二元資料,具備等同「0,1」的準連續性,也可適用連續資料的分析工具。
等序資料與無母數統計(Non-parametric statistics)
等距、等比2種資料所適用的統計方法,稱為母數統計(Parametric statistics)。
而類別資料與等序資料,適用的統計方法,稱為無母數統計(Non-parametric statistics)
如在SPSS 的資料型態中:分作Scale, Ordinal, Nominal 等3型;不過,在一般研究中,即碩士階段前的研究,我們都把前兩者合併為連續(可計量)資料,與第三型的類別資料對稱,作為選擇統計工具的依據。等序資料(Ordinal),只有配合無母數統計工具時應用。
等序資料與母數統計(Parametric statistics)或無母數統計(Non-parametric statistics)工具選擇,密切相關。我們在此先埋下伏筆,待「機率分配」單元後,再一併討論。
 多項資料與多元資料
與binomial 相對的有polynomial, multinomial,中譯都是「多項」,但polynomial是指「多terms或多次」,只有二元,形式如下:
![]()
multinomial則是「多元」,形式如下:
![]()
所以作者建議「項」和「元」的意義最好要能明確區別。
「元」是指「變項」,代數的意義則是指未知數。方程式的效標可以不是變數,而是常數,所以,這時對代數而言,可以有一元方程式。
資料收集的策略
資料收集有以下幾項應注意的策略。
連續資料優先於類別資料
某一變項可為連續資料或類別資料時,應以連續資料型態收集,優先於類別資料型態。
典型的範例是「年齡」變項。
在傳統、與以抄寫剪貼為主的當前教科書,以及受到這些教科書與長期「社會相信」所影響的許多研究實務,在收集「年齡」變項時,都作了事前歸類,譬如:「20歲以下、21-40歲、41-60歲、61歲以上」等。
「年齡」事前歸類包括以下各種缺點:
1. 分類主觀,欠缺客觀與邏輯必然性。
2. 無法彈性調整,如果發現不應該以20歲為區間分割,已無法復原調整。
3. 無法提供細膩分析結果,「年齡」原來是連續資料,可較類別資料有更深入的分析。
4. 不易作為歷史資料可長期使用,而多成為「一次」研究資料。
「年齡」是連續資料,就應該以連續資料之型態收集,譬如詢問:
「請問你出生年,是民國幾年?」
以歷史的陡階檢定歸類
這樣的資料型態有以下優點:
1. 可以提供細膩分析結果,同時,可以使用「陡階檢定」,在有分類必要時,選擇更合理、具客觀與邏輯必然性的切點。譬如,年齡對人類行為影響,可能是發生在重要歷史事件上,如臺灣光復、蔣經國總統廢除戒嚴、李登輝總統直選當選…或臺灣躍居亞洲經濟4小龍之首、開放觀光、傳統產業外移…等等,而非「幾歲」。
2. 可以自由彈性建構不同的「年齡層」,甚至比較不同分類的結果。
3. 可作為歷史資料長期使用,進而與其他資料庫整合,可作為資料探勘、大數據分析之用。
在極早期的數量研究,為何像「年齡」等連續變項時,都作事前歸類?其實有時代的工具限制性。
那時都用手工運算,連續資料的分析運算,在資料量大時,非常吃力、容易出錯,所以改用較簡易、但深度也較淺的類別資料型態。
但在當前資料與電腦時代,運算可用軟體代勞,收集資料當然應以品質為第一優先選擇。
在當前研究方法、統計分析、微積分、及其他有傳統的科目教科書,還有許多沒有跟上資訊數位時代的例子,值得我們檢討、重視與改革。
物理/行為資料優先於心理/態度資料
這個部分,移至「測量設計」的「心理、態度、行為量表」,再詳細討論。
品質資料與量化資料的認識與抉擇
這個部分,請參考「定量方法對定性方法」專文。
 資料的視覺呈現
資料標準化
如果擬比較不同刻度、或不同尺度(單位不同)的資料,為降低視覺比較的障礙,可先作資料標準化。
公式如下:

如果 n=1,則資料值在 0~1 之間,是最常見的標準化值。
統計圖
統計量可以圖形的方式視覺呈現,不過,公共統計(政府統計、商務統計)與學術統計使用的圖不盡相同。
公共統計圖
公共統計常用的圖形有:條圖、餅圖、柱圖、折線圖、雷達圖(5邊形)…等,為了視覺的美觀效果,又可分平面圖和立體圖。
 公共統計圖的繪製
公共統計圖一般可以經由文書或排版軟體繪製,實作介紹請按這裡。
學術統計圖
學術統計常會使用的圖包括以上各種公共統計圖,再加上更多細膩的圖形,如「品質7圖(Seven Basic Tools of Quality)」:
Histogram
Scatter diagram
Check sheet
Cause-and-effect (also known as the "fish-bone" or Ishikawa) diagram
Control chart
Pareto chart
Stratification (alternately, flow chart or run chart)
其中最常用的則是直方圖 (Histogram) 、散佈圖(Scatter plot)和流程管製表 (Check sheet)。
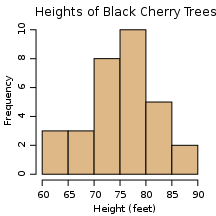
直方圖 Histogram
 直方圖是由
Karl Pearson 所設計的一種二維統計圖表,它的兩個座標分別是統計樣本和該樣本對應的某個屬性的度量。
直方圖與條形圖的區別在於,直方圖是用面積而非高度來表示數量。直方圖由一組塊形組成,每一個塊形的面積表示在相應的小組區間中事例的百分數。採用密度尺度,每一個塊形的高度等於相應小組區間中事例的百分數除以該區間的長度。其面積呈現為百分數,總面積為100%。直方圖下兩個數值之間的面積給出了落在那個區間內的事例的百分數。
A histogram is a graphical representation showing a visual impression of the
distribution of data. It is an estimate of the probability distribution of a
continuous variable and was first introduced by Karl Pearson. A histogram
consists of tabular frequencies, shown as adjacent rectangles, erected over
discrete intervals (bins), with an area equal to the frequency of the
observations in the interval. The height of a rectangle is also equal to the
frequency density of the interval, i.e., the frequency divided by the width
of the interval. The total area of the histogram is equal to the number of
data. A histogram may also be normalized displaying relative frequencies. It
then shows the proportion of cases that fall into each of several
categories, with the total area equaling 1. The categories are usually
specified as consecutive, non-overlapping intervals of a variable. The
categories (intervals) must be adjacent, and often are chosen to be of the
same size. The rectangles of a histogram are drawn so that they touch each
other to indicate that the original variable is continuous.
Histograms are used to plot density of data, and often for density
estimation: estimating the probability density function of the underlying
variable. The total area of a histogram used for probability density is
always normalized to 1. If the length of the intervals on the x-axis are all
1, then a histogram is identical to a relative frequency plot.
散佈圖 Scatter plot
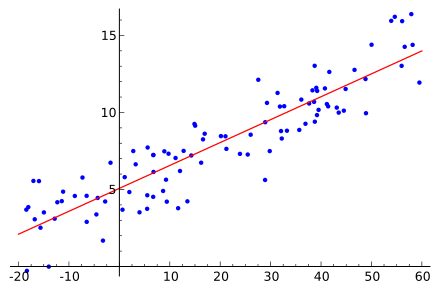
 散佈圖採用笛卡兒坐標系(Cartesian坐標系)-也稱直角坐標系,表現變項間關係的圖形。它是一種正交坐標系,二維的直角坐標系是由兩條相互垂直、0
點重合的數軸-代表2個變項構成的。
通常以X為自變項、以Y為應變項。在平面內,任何一點的坐標 是根據數軸上 對應的點的坐標設定的。在平面內,任何一點與坐標的對應關係,類似於數軸上點與坐標的對應關係。
![]() 註:在笛卡兒(René
Descartes)的時代,拉丁文是學者的語言。他也如當時的習慣,在他的著作上簽上他的拉丁化的名字
Renatus Cartesius(瑞那圖斯·卡提修斯)。正因為如此,由他首創的直角坐標系直譯的話,會是卡提修坐標系。然而,笛卡兒用法文寫作而不用拉丁文,這也表示當時拉丁文的歐洲學術語言地位正不斷趨於廢棄。
註:在笛卡兒(René
Descartes)的時代,拉丁文是學者的語言。他也如當時的習慣,在他的著作上簽上他的拉丁化的名字
Renatus Cartesius(瑞那圖斯·卡提修斯)。正因為如此,由他首創的直角坐標系直譯的話,會是卡提修坐標系。然而,笛卡兒用法文寫作而不用拉丁文,這也表示當時拉丁文的歐洲學術語言地位正不斷趨於廢棄。
流程管製表 Check sheet
流程管製表(Check sheet),是由亨利·甘梯於1910年開發出,原始以其名稱為「甘梯圖(Gantt chart)」,中譯也有作「甘特圖」。它是條圖的進階應用,且具梯狀,故「甘梯圖(Gantt chart)」之名更能達意。近年,則逐漸被稱為一般化的流程管製表(Check sheet)。
本表主要用在專案管理中,分析專案的「作業、時程、財務」,包括:終端元素的開始和結束,以表格方式顯示時間進度、作業項目、以圖形表達與時間相關的元素與事件,反映專案管理中隨著時間進展的各內在關係,以及產生的各種成本、預算、與資源需求。
A Gantt chart is a type of bar chart, developed by Henry Gantt, that
illustrates a project schedule. Gantt charts illustrate the start and finish
dates of the terminal elements and summary elements of a project. Terminal
elements and summary elements comprise the work breakdown structure of the
project. Some Gantt charts also show the dependency (i.e., precedence
network) relationships between activities. Gantt charts can be used to show
current schedule status using percent-complete shadings and a vertical
"TODAY" line as shown here.
Although now regarded as a common charting technique, Gantt charts were
considered revolutionary when first introduced. In recognition of Henry
Gantt's contributions, the Henry Laurence Gantt Medal is awarded for
distinguished achievement in management and in community service. This chart
is also used in Information Technology to represent data that have been
collected.
本表可應用在廣泛的領域中,舉幾個範例如下,並可在範例比較中,領悟管製表設計的重點:
1.列的設計:專案的系統分析
2.欄的設計:作業項目的合理時程
3.細格的設計:作業元素彼此的結構、前後、造成關係,以不同圖形表現。
 行為調查專案流程管製表
 資訊系統發展專案流程管製表
以上2個範例是真實的教學實作範例,但因為是「教學」目的,所以沒有包括「財務」的行列。
就企業管理而言,必須增加「財務」項目,包括:作業需求成本或資源、預算與必須支出費用的時間點、與相應的收入時間點…等等。
在網路的進步下,當前管理者更可發展具備互動、群體管理功能的線上管製表:
 數位文創群體專案流程管製表
不過,也有論者認為流程管製表(Check sheet)只適合中小型專案管理,超過30個子專案的大型專案,本表便無法負荷,即使電腦化,也難以閱讀。
Gantt charts have become a common technique for representing the phases and
activities of a project work breakdown structure (WBS), so they can be
understood by a wide audience all over the world.
A common error made by those who equate Gantt chart design with project
design is that they attempt to define the project work breakdown structure
at the same time that they define schedule activities. This practice makes
it very difficult to follow the 100% Rule. Instead the WBS should be fully
defined to follow the 100% Rule, then the project schedule can be designed.
Although a Gantt chart is useful and valuable for small projects that fit on
a single sheet or screen, they can become quite unwieldy for projects with
more than about 30 activities[citation needed]. Larger Gantt charts may not
be suitable for most computer displays. A related criticism is that Gantt
charts communicate relatively little information per unit area of display.
That is, projects are often considerably more complex than can be
communicated effectively with a Gantt chart.
Gantt charts only represent part of the triple constraints (cost, time and
scope) on projects, because they focus primarily on schedule management.
Moreover, Gantt charts do not represent the size of a project or the
relative size of work elements, therefore the magnitude of a behind-schedule
condition is easily miscommunicated. If two projects are the same number of
days behind schedule, the larger project has a larger effect on resource
utilization, yet the Gantt does not represent this difference.
Although project management software can show schedule dependencies as lines
between activities, displaying a large number of dependencies may result in
a cluttered or unreadable chart.
不過,以上評論似乎出於傳統人際管理行為經驗的見解。統雄老師建議,這方面應與資料庫設計、表單介面設計、決策支援系統設計作跨領域的整合考量,並非完全不可克服。
流程管製表(Check sheet)一般以管理品質資料、類別資料、非量化資料見長,但也有一些變形,可作為量化資料統計工具,如以下工廠管理常見的品管表:
When a process has been identified as a candidate for improvement, it's important to know what types of defects occur in its outputs and their relative frequencies. This information serves as a guide for investigating and removing the sources of defects, starting with the most frequently occurring.
This type of check sheet consists of the following:
A single column listing each defect category
One or more columns in which the observations for different machines,
materials, methods, operators are to be recorded
Note that the defect categories and how process outputs are to be placed
into these categories must be agreed to and spelled out in advance of
constructing the check sheet. Additionally, rules for recording the presence
of defects of different types when observed for the same process output must
be set down.
When assessing the probability distribution of a process one can record all process data and then wait to construct a frequency distribution at a later time. However, a check sheet can be used to construct the frequency distribution as the process is being observed.
學術統計圖的繪製
高級的統計軟體如 SPSS也會針對各種特殊統計工具,提供不同的視覺分析圖形,到實際階段時,再一一介紹。
資料收集
資料收集包括:資料的對象、資料的測量、資料的取得、資料的整理(又包括:編碼、檢誤、特異值篩選、轉碼…等)。
資料收集是一個完全不同,且體制龐大的研究領域。
請另參考統雄老師的「研究方法/民調市調樂學講義系列」。
 統計與理論建構篇
 基本統計方法應用-SPSS篇
統計符號 http://cnx.org/content/m16302/latest/


