因徑分析/結構方程模型 詮釋
Path Analysis and SEM 1: Interpretation
神掌打通任督二脈‧易筋經以簡馭繁
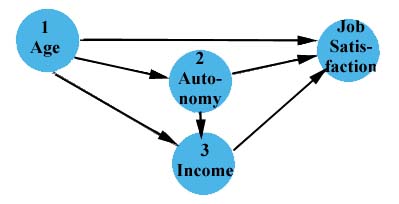
工作滿意度的因徑概念模型
因徑模型的聯立方程式組
因果關係:直接效果與間接效果
篩選自變項
篩選相關變項
檢查中介效果與篩選中介變項
經由多元迴歸分析篩選中介變項
檢查標準化多元迴歸係數
檢查間接效果
建立因徑/SEM模型並檢定因果關係/總效果
驗證式因徑/SEM模型建構
因徑模型的詮釋
不好就打掉重作‧才是科學精神
因徑分析/結構方程模型特性
因徑分析(Path analysis)-1980年代後稱為結構方程模型(Structural equation modeling, SEM)-的目的在於建構1組「多變項的因果模型」,也就是包括:應變項、自變項、中介變項或調節變項、具備「因果關係」-不僅是「相關關係」的理論。
因徑/SEM模型分析與建構的基礎技術是多元迴歸,並應先有共變項分析、中介模型分析的前置觀念。
Path analysis is an extension of the regression model, used to test the fit of the correlation matrix against two or more causal models which are being compared by the researcher. The model is usually depicted in a circle-and-arrow figure in which single-headed arrows indicate causation. A regression is done for each variable in the model as a dependent on others which the model indicates are causes. The regression weights predicted by the model are compared with the observed correlation matrix for the variables, and a goodness-of-fit statistic is calculated. The best-fitting of two or more models is selected by the researcher as the best model for advancement of theory.
在統計軟體問世後,有些產品將因素分析、多元迴歸與因徑分析的功能結合,並命名為結構方程模型,也就是先將量表的項目萃取出「因素」-理論建構上稱為「潛在變項、或構念」後,再進行多元迴歸、因果模型建構。
所以,有的文獻將沒有作因素萃取的研究過程稱為因徑分析,而有因素萃取的稱為SEM,還有些文獻作了更細瑣的分類條件。統雄老師則建議,就大方向而言,這些區別是不太必要的。
較新之統計軟體,如LISREL, SPSS Amos,不必跑多支程式,可一次完成因素分析、多元迴歸與因徑分析,並一次提供較多訊息,如共變與殘差,則是SEM常見的專用分析工具。。
使用這類軟體,節省了許多程序,也可能會略過了許多思辨的過程,形成更多垃圾進出現象。
Path analysis requires the usual assumptions of regression. It is particularly sensitive to model specification because failure to include relevant causal variables or inclusion of extraneous variables often substantially affects the path coefficients, which are used to assess the relative importance of various direct and indirect causal paths to the dependent variable. Such interpretations should be undertaken in the context of comparing alternative models, after assessing their goodness of fit discussed in the section on structural equation modeling (SEM packages are commonly used today for path analysis in lieu of stand-alone path analysis programs). When the variables in the model are latent variables measured by multiple observed indicators, path analysis is termed structural equation modeling, treated separately. Many follow the conventional terminology by which path analysis refers to modeling single-indicator variables. However, Sean TX Wu considers it is not a necessary difference.
理論必須與分析工具配合
電腦繪圖工具問世後,許多論文呈現流行形象複雜化,喜歡配多變項概念模型圖,但分析工具又是一般統計教科書上所載的雙變項統計法。
多變項理論不能以單變項、雙變項分析工具證明
相關類型理論如果存在中介變項,必須以Path Analysis (因徑分析)亦即 SEM (Structural Equation Modeling 結構方程模型)證明
(以下範例資料取材自:http://faculty.chass.ncsu.edu/garson/pa765/statnote.htm)
Path Analysis 因徑分析
基於多元迴歸分析法的應用。
代表性範例:工作滿意度的因徑模型
Bryman, A. and Cramer,D. 1990: Quantitative data analysis for social scientists. London: Rout ledge, p. 246-251.
這個範例幾乎是國際因徑分析教學的聖經。
工作滿意度的因徑概念模型
譬如,有一項研究發現,年齡與工作滿意度呈正相關。
如果此項理論成立,則將導出奇怪的應用:聘用員工的時候,聘年齡愈高的愈好。
進一步探索,真正影響工作滿意度的因素其實應該是另外2項因素:
1.「薪資」,因為薪資為隨著年資、也就是年齡而成長,所以表面看起來年齡會影響工作滿意度。
2. 工作自主程度,而自主程度通常也來自擔任高階、或資深職務,也是因為隨著年齡漸增而取得。
同時,擔任高階、或資深職務,也會提升薪資。
但如果薪資並沒有增加、工作自主程度也不高,亦即真正的因素沒有發生,年齡變大並不會提升工作滿意度。
根據對原始「「年齡 → 工作滿意度」理論的辯難,而擬探索建構以下因徑分析/結構方程模型。
待證模型(Input diagram)
表示各種變項與影響方向。
如果已知影響為正或負,可在箭身旁加注 + 或 - 符號。

應變項:工作滿意度
自變項:年齡
中介變項:自主程度、收入
因徑模型的聯立方程式組
因徑模型就是1組聯立方程式(simultaneous equations)的視覺呈現。
結構方程模型名稱由來,其中「結構」就是有「一組」的意思。
每一條路徑由1組簡單迴歸或多元迴歸方程式所組成,方程式式數相當所有應變項與中介變項的總和。
![]() 方程式的「效標」,就是理論建構的「應變項」,「因子」就是理論建構的「自變項」或「中介變項」。
方程式的「效標」,就是理論建構的「應變項」,「因子」就是理論建構的「自變項」或「中介變項」。
各應變項與中介變項為各方程式的效標,而箭頭的來源,即為方程式的因子。所以:
方程式 1. satisfaction = β11age + β12autonomy
+ β13
income + e1
方程式 2. income = β21age + β22autonomy
+ e2
方程式 3. autonomy = β31age + e3
β: 標準化迴歸係數,其平方為該因子可解釋的百分比。有些文獻習慣稱為因徑係數(path coefficients)。
e: 誤差,或稱殘差 (residual)
|
|
因果關係:直接效果與間接效果
計算β值如下:
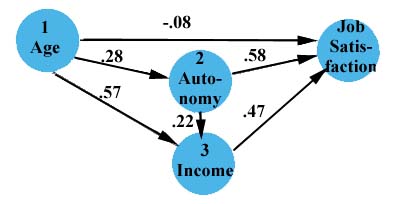
β11 = -.08, β12 =.58, β13
=.47
β21 =.57, β22 =.22
β31 =.28
已證模型(output diagram)
在箭身旁加注因徑係數。

無中介變項的為直接效果,經過中介變項的為間接效果。
間接效果為β值之積
age -> income -> satisfaction is .57*.47 = .26
age -> autonomy -> satisfaction is .28*.58 = .16
age -> autonomy -> income -> satisfaction is .28 *.22
*.47 =.03
間接效果之和 = .45
總因果效果為直接效果加間接效果
(-.08 + .45) = .37
因徑分析/結構方程模型 圖形元素名稱
Causal Graphs/ Path Diagrams
因徑分析/結構方程模型盛行後,其圖形稱為 Causal Graphs/ Path Diagrams ,其中變項有特定名稱。
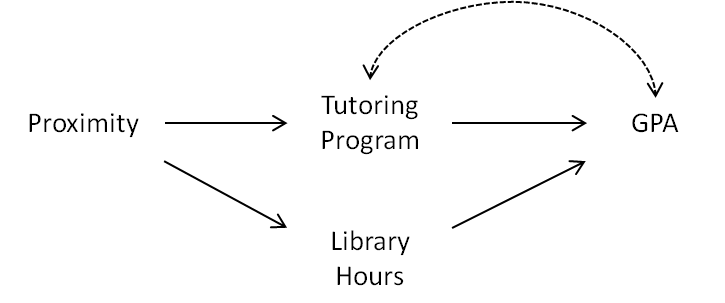
以下是個在各文獻中,經常出現的一個範例圖形。

Tutoring Program:參加課輔時間。為中介變項之一,既為自變項、也為應變項,在此例中,設為主要研究自變項。
Library Hours:在圖書館時間。為中介變項之一。
Proximity:到課輔地點、圖書館的距離。為被中介的自變項。
圖形中各元素名稱如下。
處理變項 Treatment
主要研究自變項,特稱為:處理變項 Treatment。在此即為 Tutoring Program。
尤其在實驗法中,均採用此專有名詞。
工具變項 Instrumental Variable/ Instrument Variable
被「處理變項」中介的自變項,特稱為:工具變項 Instrumental Variable/ Instrument Variable。在此即為 Proximity。
英文文獻經常稱為「第三變項」,才是正確思維。許多中文文獻將中介變項稱為第三者,實屬對模型效果的誤認。
未測變項 Omitted Variable/ 雙箭頭虛線
如在模型中,可能仍存在未測變項 Omitted Variable,則以雙箭頭虛線表示。
譬如學生的企圖心、是否打工…可能同時影響參加課輔時間、學業成績,但在此模型未列入研究。亦即可能還有其他的處理變項、工具變項、或混擾變項 Confounder/ Confounding Variable。
對撞變項 Collider
受到2個以上自變項影響的變項,特稱為對撞變項 Collider。在此即為 GPA。
對撞變項2個以上自變項的 β 都很大時,如果少測1個自變項,會造成偏差認識。
SPSS 應用範例:探索式因徑模型建構
 統雄數學樂學/統計神掌易經筋-問卷


